
-1.png)
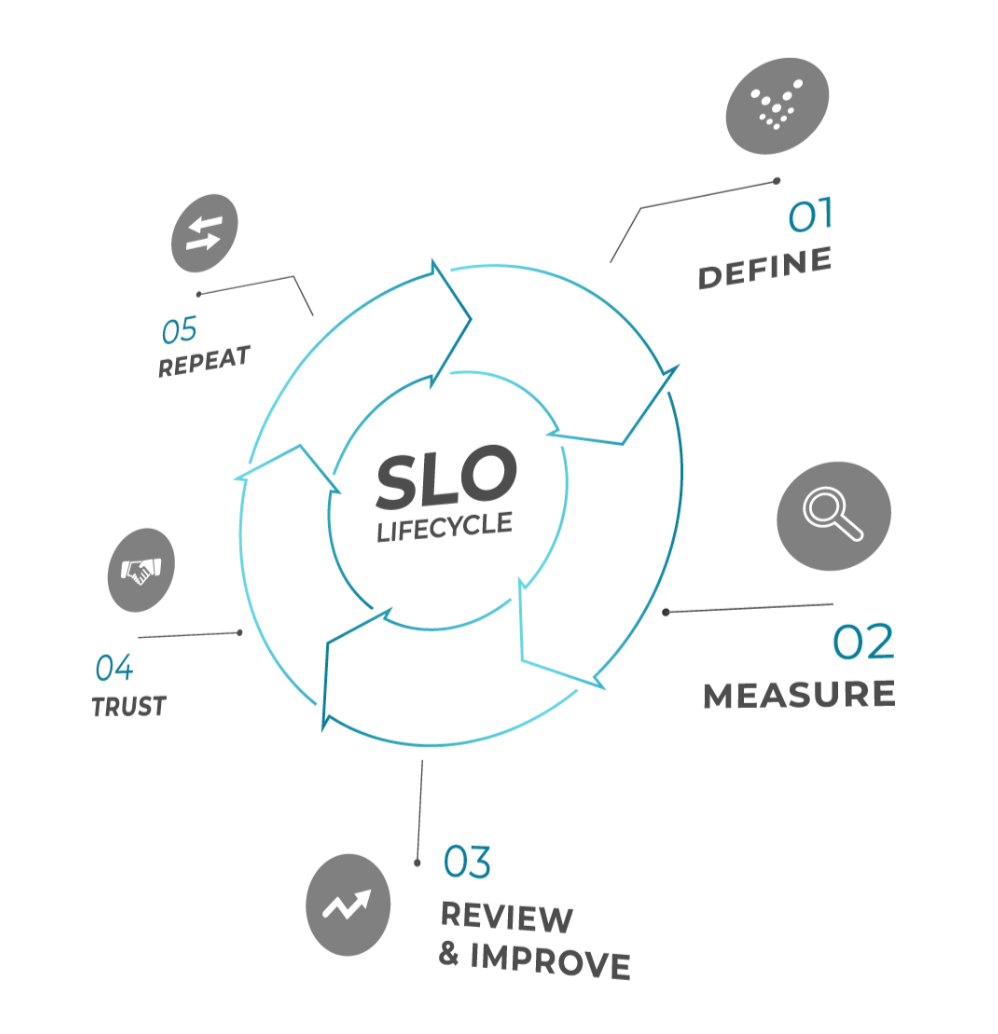
Table of Contents
Like this article?
Subscribe to our Linkedin Newsletter to receive more educational content
Subscribe nowService level concepts

SLI, SLA, and SLO metrics coexist to help measure customer satisfaction.
Clear performance and reliability expectations are essential for effective IT service management. SLIs, SLOs, and SLAs are the three primary service level concepts that come together to create a comprehensive framework for monitoring, managing, and communicating service reliability. Let’s explore these three essential service level concepts in depth.
Service level indicator (SLI)
A service level indicator (SLI) is a quantitative measure of service reliability from a user-centric perspective. SLIs can take several forms:
- Success ratios (good events / valid events) measured over a time window
- Latency percentiles like “ 95th percentile request latency”
- Throughput measurements like requests per second,
- Availability measurements like the percentage of time a service is operational.
For instance, here is a basic transaction success rate SLI:
Transaction success rate = (Successful transactions / Valid transactions) *100
For this SLI, successful transactions are all transactions that meet defined success criteria, while valid transactions are all transactions excluding invalid requests and planned maintenance windows. Measurement occurs over a specified time window, for example, rolling 28 days.
Organizations often adapt and enhance this basic formula, incorporating techniques like weighted measurements, satisfaction scores, or moving averages to better match their specific service characteristics.
The specific form of an SLI should align with how users experience services. For instance, an e-commerce platform might care more about checkout success rates, while a content delivery service might focus on latency percentage.
Service level objective
A service level objective (SLO) is a target that defines acceptable service performance over a specific period. SLOs are essential for teams of all sizes because they help track if user expectations are met and maintain service quality.
For example, teams may define SLOs such as:
“97% of transactions must succeed over a rolling 30-day window”
or
“95% of page loads must complete within 3 seconds measured monthly”
Service level agreement (SLA)
A service level agreement (SLA) is a contractual agreement that defines performance commitments to customers. SLAs are typically expressed as target levels for specific SLIs over defined time periods. Because SLAs are contractual agreements, service providers may face financial and legal consequences for SLA breaches.
The lines between SLAs and SLOs often confuse those new to IT service management. The concepts are related, but different:
- SLAs are contractual obligations to a customers
- SLOs are internal service goals that are typically set more strictly than SLAs.
While SLOs are not typically shared with external customers, they are crucial to meeting SLAs.
Customer-Facing Reliability Powered by Service-Level Objectives
Service Availability Powered by Service-Level Objectives
Learn More
Integrate with your existing monitoring tools to create simple and composite SLOs

Rely on patented algorithms to calculate accurate and trustworthy SLOs

Fast forward historical data to define accurate SLOs and SLIs in minutes
Five types of SLO metrics
Depending on the kind of service you are measuring reliability for and the expected outcome, several different types of SLOs might be relevant. The sections below explore five common types of SLO metrics and their use cases.
Availability-driven SLOs
These SLOs measure the percentage of time a service is accessible and operational to meet the users' expectations for the service´s uptime. Some example scenarios where ability-driven SLO metrics are helpful include:
|
Aspect |
Use case |
Example SLO |
|
General web service availability |
Ensures users can consistently access a web page |
The webpage must be available 99.9% of the time over a rolling 30-day window. |
|
API availability |
Ensures availability for critical functions in a web platform like user authentication |
The /login API endpoint must respond with 2xx or 3xx status codes for 99.5% of requests over a 30-day window. |
|
Database availability |
Ensures backend systems can process transactions and queries without interruptions |
The primary database must successfully respond to health checks 99.9% of the time during defined business hours (9AM-5PM local time). |
|
Geographical availability |
Ensures location-specific reliability for global platforms |
The service must achieve 99.6% availability for valid requests in the EMEA region over a 30-day window. |
Latency-driven SLOs
These SLOs measure the time it takes for a service to respond to a request or complete a transaction to ensure fast performance for users. Some example scenarios where latency-driven SLO metrics are helpful include:
|
Aspect |
Use case |
Example SLO |
|
Website page load time |
Ensures an uninterrupted user experience. Slow page loads can lead to frustration and low adoption |
95th percentile of webpage loads must be completed within 3 seconds over a 30-day window. |
|
API response time |
Ensures smooth interaction between different microservices relying on API requests |
95th percentile of valid API requests must respond within 150 ms over a 30-day window. |
|
DB query latency |
Ensures real-time response on fetching data, e.g. users searching for products on an e-commerce platform |
95th percentile of database queries must be completed within 100 ms during peak hours. |
|
Geographical latency |
Ensures location-specific targets are reached during peak seasons |
95% of API requests originating from the AMRS region must respond within 200ms during the Black Friday season (Nov 15 to Dec 31). |
Throughput-driven SLOs
These SLOs measure the rate at which a system processes requests or handles transactions. They ensure the system can handle the expected load without performance degradation. Some example scenarios where throughput-driven SLO metrics are helpful include:
|
Aspect |
Use case |
Example SLO |
|
Web service throughput |
Ensures bottlenecks during peak hours are avoided |
The checkout service must process 500 orders per minute with 95% success during the November-December peak hours. |
|
API throughput |
Ensures high-traffic APIs, for example, payment processes or social media platforms, can handle demand during peak usage periods |
The API must handle 1,000 requests per second with 99% success. Measured over a 5-minute window. |
|
DB query throughput |
Ensures fast and accurate search functionality for high-traffic platforms |
The search service must handle 30 queries per second with a 99.9% success rate during business hours. |
|
Operational throughput |
Ensures consistent performance for PaaS/SaaS platforms |
The cloud storage service must process 100 file uploads per second with a 99.5% success rate. |
Error rate-driven SLOs
These SLOs measure the percentage of failed or incorrect responses from a service. They ensure the minimization of disruptions and errors directly impacting user experience. Some example scenarios where error rate-driven SLO metrics are helpful include:
|
Aspect |
Use Case |
Example SLO |
|
Web service error rate |
Ensures smooth user experience, which is critical for user retention. |
Authentication attempts must maintain a success rate of 99.9% (error rate <0.1%) over a 30-day rolling window. |
|
API error rate |
Ensures reliable interactions for users or applications relying on API responses. |
The API must maintain a success rate of 99.5% over a rolling 7-day window. |
|
DB query error rate |
Ensures databases operate smoothly without causing application-level errors. |
Database queries must maintain a success rate of 99.8% over a rolling 30-day window. |
|
Network packet drop rate |
Ensures transparency on network performance. |
Network packet delivery success rate must exceed 99.9% across all monitored paths, measured over 5-minute windows. |
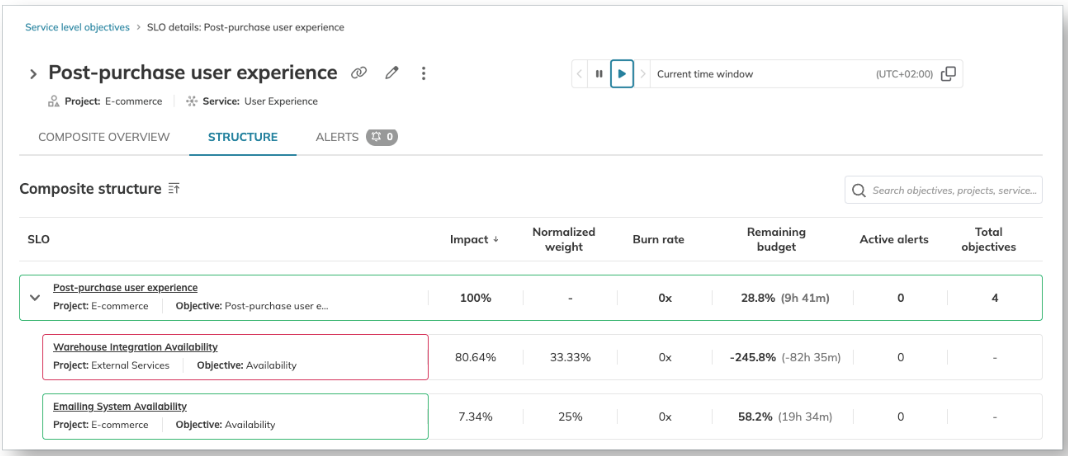
Composite SLOs
In complex systems, having isolated SLOs for individual services may not provide a complete view of end-to-end system reliability. Composite SLOs combine multiple component-level SLOs to measure the overall health from a user perspective.
Consider the human body as an example, where different organs (components) must work together to maintain overall health (the composite goal). The overall health (system reliability) depends on all components (heart, lungs, liver, etc.) working together. The composite SLO will suffer if one system fails to meet its SLO. Similarly, having siloed SLOs for each service is insufficient to get a big-picture view of a service ecosystem.
For example, consider an e-commerce checkout flow:
- Frontend service: 99.9% availability
- Authentication service: 99.9% availability
- Payment processing: 99.9% availability
- Order management: 99.9% availability
While each service meets a strong individual SLO, the actual user experience depends on all services working together. The composite SLO would typically be lower than any individual SLO, as it represents the probability of all required components working successfully together.
Composite SLOs ensure teams measure and optimize for the complete user journey rather than individual service performance. They help teams understand true end-to-end reliability and set realistic targets that reflect the user experience.
To learn more about composite SLO metrics, refer to this official documentation.
Customer-Facing Reliability Powered by Service-Level Objectives
Service Availability Powered by Service-Level Objectives
Learn More
Defining and setting up SLO metrics
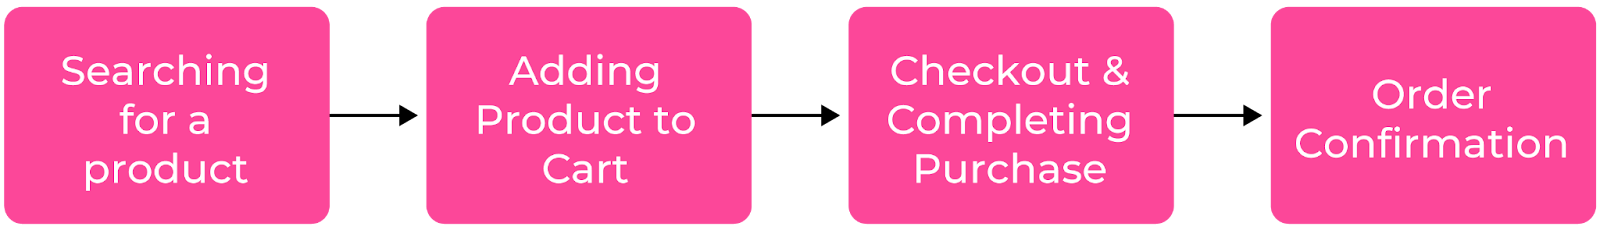
To effectively identify your SLIs and set up corresponding SLOs, you must first understand what matters to your customers. This process is called customer journey mapping.
Identify the most critical user journeys to help capture the experience of the customers of the product. A critical user journey is a series of steps or tasks that is a core part of a user's experience. For highly complex systems, you should decompose services to understand their criticality, role, dependencies, and data sources. For example, the critical user journey in an online shopping experience would be:
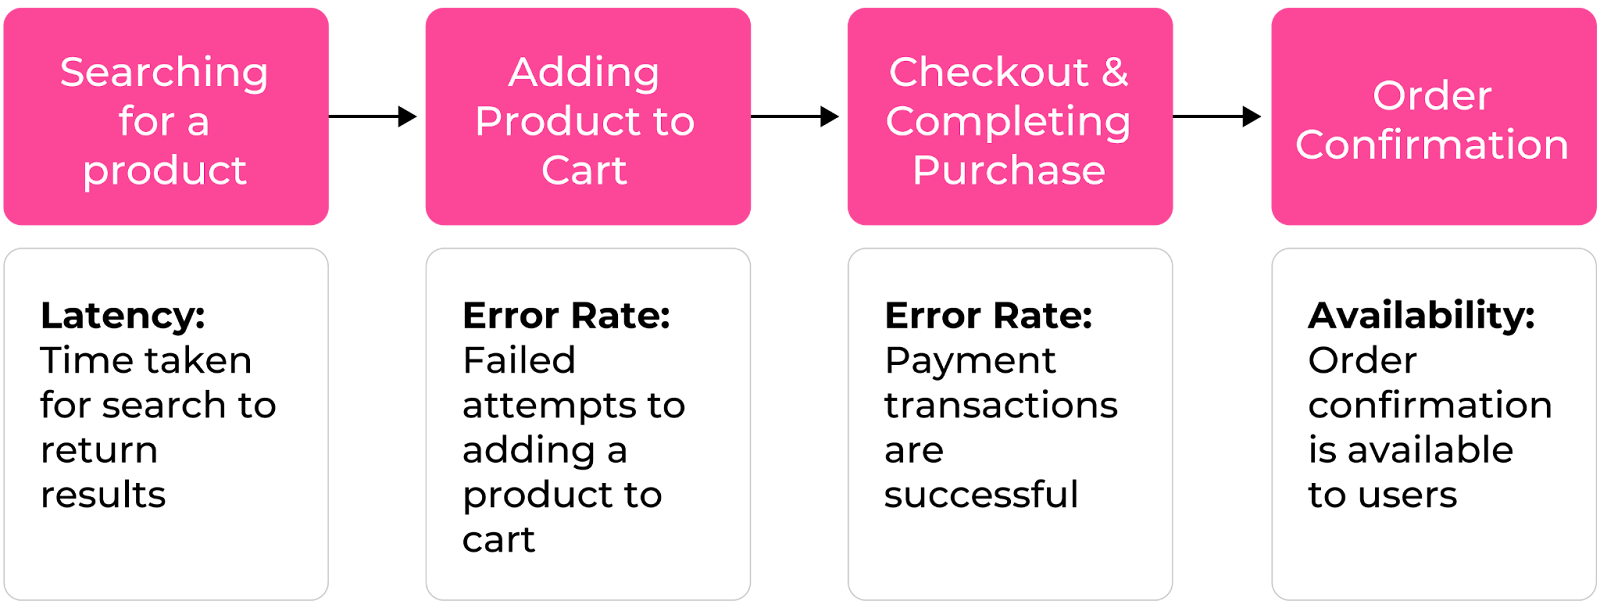
Once the journey has been identified, determine which SLIs best reflect the user experience. These metrics can be availability, latency, throughput, error rate driven, or even custom metrics depending on the use case at hand:
The next step is to define the target SLO against which you would measure reliability. This target should be realistic based on historical data, user feedback, and upcoming business priorities.

To ensure SLOs are truly useful, follow the VALET principle:
- Valuable—The SLO should focus on metrics that matter to the business and user experience and not only to internal teams.
- Actionable—Direct actions should be set up when the SLO is breached (team notifications, resolution runbooks, etc.).
- Legitimate—The SLO should be based on relevant, measurable data from trusted sources, with consistent methods.
- Explicit—The SLO should be unambiguous, clearly defined metrics and measurement windows.
- Testable—The SLO should be verifiable and validated using existing monitoring tools.
Once you have identified your SLOs, you can use them to track service reliability. However, remember that SLOs are not set in stone. You must revisit, refine, and iterate your SLOs regularly, for example, by adjusting them based on past performance data and changing business needs.
Seven practical best practices for SLO metrics
There is no one-size-fits-all SLO implementation that will work for every time. Getting SLOs right requires a combination of expertise, context, and tooling. That said, there are proven best practices that can make the process simpler and help organizations get the most out of their SLOs. In the sections below, we’ll explain seven proven SLO best practices to help teams avoid common SLO mistakes and improve their operations.
Use the KISS principle
Keep it Short and Simple, or KISS, applies perfectly to defining SLOs. Pick an aspect of your system that is relevant and easy to measure. Then, choose a few critical metrics (e.g., availability, latency, error rate) that are the most relevant to user experience, and with the VALET principle in mind, define your SLOs based on those metrics.
Emphasizing simplicity in this process can make a significant difference in quality and ease of use. For example, consider these two SLOs:
- SLO 1: 99.5% of users of an e-commerce platform complete the checkout process within 5 seconds unless they encounter timeout or network errors
- SLO 2: 99.5% of checkout requests on an e-commerce platform should be completed within 5 seconds over a rolling 30-day window.
SLO 1 is complex because it includes exceptions and is challenging to measure because it tracks user traffic instead of website performance. On the other hand, SLO 2 is a simple latency SLO that considers the KISS principle—it is simple to measure, user-centric, testable, and actionable by the teams if breached.
Start small and iterate
Often, it can be overwhelming in highly complex organizations to understand where to start defining SLOs. Here, it helps to start simple:
- First, choose one application for which you want to define SLOs. Later, if necessary, you can add other sub-apps or dependencies.
- Decide in simple terms who your application users are.
- Consider the common ways these users interact with the application- the user journeys.
- Draw up the high-level architecture diagram of the system, request flows, and dependencies. This diagram helps define SLIs and their corresponding SLOs
- Gradually iterate and expand the scope of SLO coverage, eventually moving to composite SLOs.
Don’t reinvent the wheel, use industry standards
Standards and frameworks such as RED, USE, and Golden Signals, can help streamline your SLO journey and avoid reinventing the wheel for problems the industry has already solved.
RED metrics
These are most suitable for user-facing applications and web services.
|
Metric |
Definition |
Example |
|
Rate |
Number of requests or transactions per second a service can handle |
Tracking the number of logins/second over a 1-minute window |
|
Errors |
Number or % of requests that fail (4xx/5xx responses) |
Error rate as % of total requests per minute |
|
Duration |
Time taken to complete a request (latency), often measured in percentiles |
95th percentile latency must be < 200ms over 5-minute windows |
USE metrics
These are most suitable for system-based resource tracking, such as servers, databases, and network devices.
|
Metric |
Definition |
Example |
|
Utilization |
Percentage of resource´s capacity utilized |
CPU > 80% over 5 minutes |
|
Saturation |
The extent to which a resource has extra work it can’t service immediately |
Memory swap rate > 10/sec |
|
Errors |
Count or rate of errors related to each resource. |
Hardware errors/minute |
Golden signals
This standard monitoring practice typically used by SRE (Site Reliability Engineering) applies to any system. If you cannot monitor any other metrics, you should focus on these four: latency, traffic, errors, and saturation.
|
Metric |
Definition |
Example |
|
Latency |
The time taken for a service to complete a request or respond to a transaction |
95th percentile “add to cart” request latency < 2 seconds |
|
Traffic |
The measure of demand of the system, typically quantified by the number of requests per second or data throughput |
Sustained rate of 1000 requests/second over 5-minute windows |
|
Errors |
Rate of requests that fail |
Error rate <0.1% of requests (excluding 4xx client errors) |
|
Saturation |
The extent to which a resource is at capacity |
Memory usage < 90% averaged over 5 minutes |
Regularly align with business objectives
SLOs must continuously evolve with business needs, user expectations, and system performance trends. Establish a regular cadence (e.g., monthly, quarterly, or semi-annually) to review SLOs and readjust where needed. Crucial questions to ask yourself during these reviews: Does the SLO still align with current user needs? Are the SLOs realistic based on historical data? Have there been any shifts in performance, user traffic, or error patterns that require updates?
For example, suppose you have a latency SLO defined for your SaaS platform as: "API latency for all regions is 500 ms for 95% of the requests, over a rolling 30-day window". Next month, there is an expansion into the Asia market, likely resulting in a higher latency due to the distance from the data center. You can readjust the SLO by setting region-specific SLOs:
- Asia: API call latency is below 700 ms for 95% of requests over a rolling 30-day window
- Other regions: API call latency is below 500 ms for 95% of requests over a rolling 30-day window
Build on metrics history
Metrics history is a data-driven process for setting up SLOs that determines how the system has performed over time. Analyzing historical metrics allows you to identify trends like seasonal traffic spikes, increasing user load, or performance degradation. It also avoids overcommitting to targets that strain resources or frustrate teams. SLO
targets should always be set within SLA commitments to customers so that teams have a sufficient buffer to address issues before they impact contractual obligations.
Nobl9 offers a comprehensive tool called SLI Analyzer for setting up SLOs based on historical data. It helps you create your first SLOs and constantly readjust them based on past data trends.
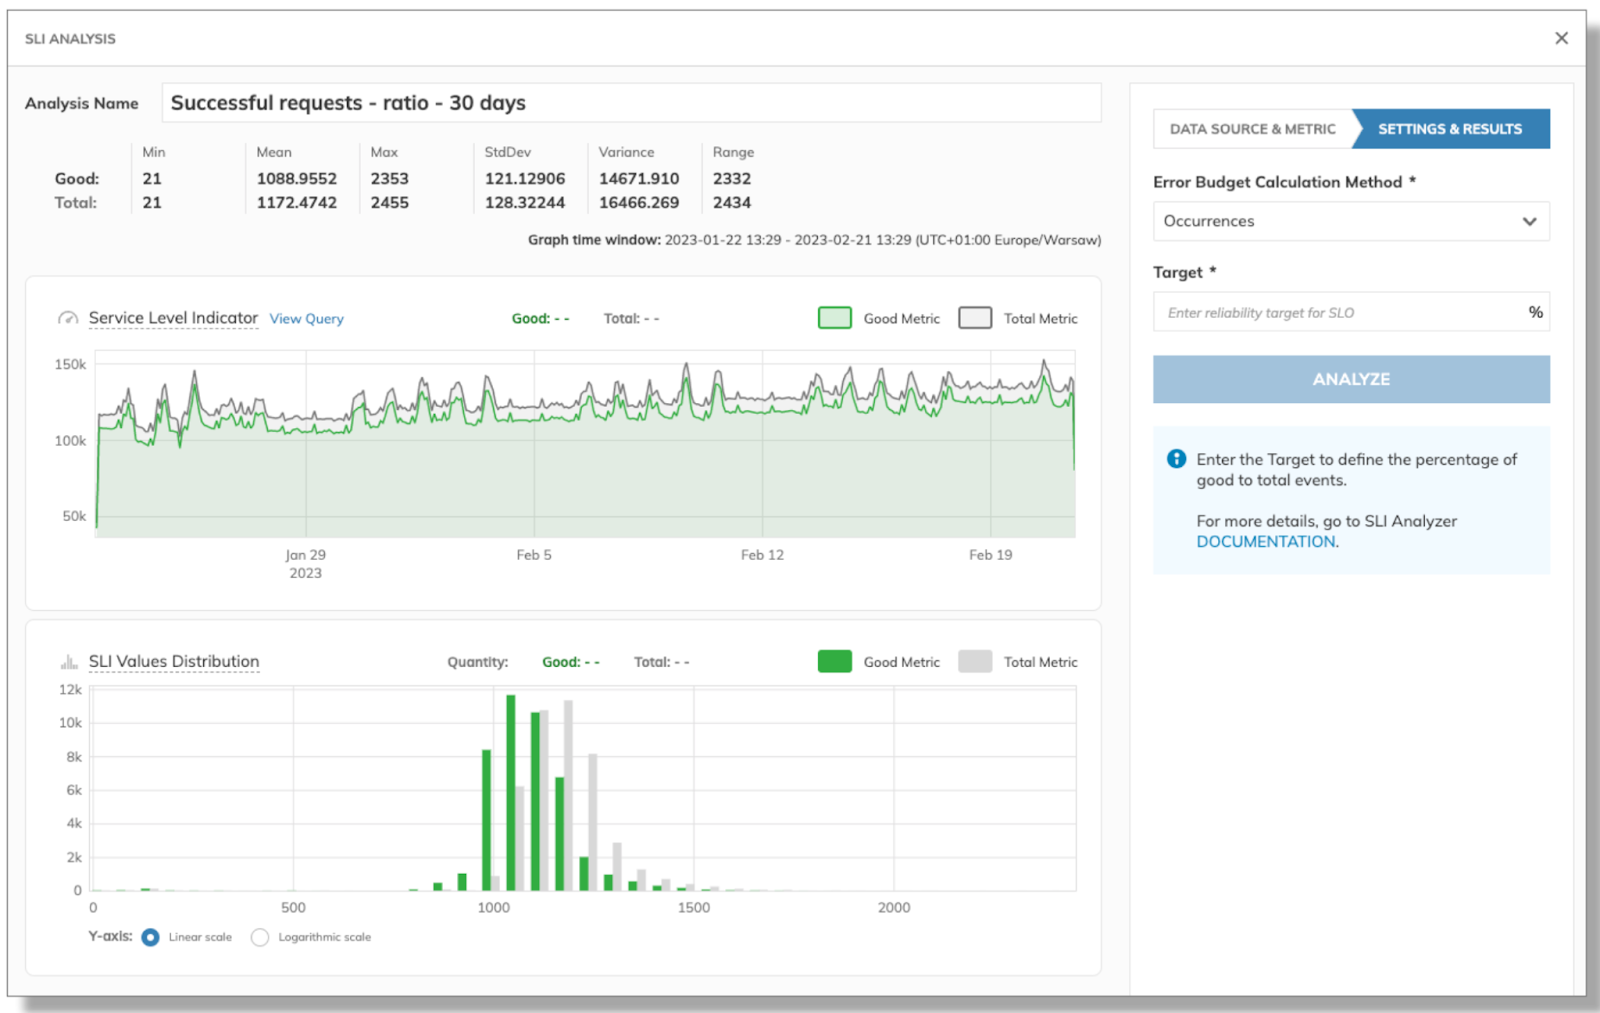
SLI Values from the last 30 days can be analyzed for “Good” vs “Total”. (Source)
Alert on the right SLOs
Configure alerts on SLOs to detect issues early, prioritize critical problems, and minimize noise.
- Focus on user impact to avoid false positive alerts: Trigger alerts only when there is a noticeable degradation in user experience. Use aggregated alerts to avoid overwhelming teams with too many notifications.
- Tie alerts to Runbooks: Alerts should include clear remediation steps (scripts, automated runbooks) to streamline incident response.
Gaining complete transparency on SLOs is challenging if you monitor your system using multiple platforms and data sources. Nobl9 provides a single Service Health
Dashboard to view “Red, Amber, Green” (RAG) status, inspect healthy SLOs, identify alert-triggering ones, and explore them further.

A single pane of glass view of all existing SLOs and their corresponding alerts (source)
Build SLO observability
Observability and SLOs are intertwined concepts that coexist to help achieve the transparency that system reliability requires.
- Collect data using MELT (Metrics, Events, Logs, Traces) to best determine which user-centric SLOs can be set up.
- Implement proactive anomaly detection to detect issues before they become SLO breaches, reducing downtime and improving user experience.
- Set up dashboards and reports to track performance against SLOs. These can be custom-setup based on the audience, scope, and requirements.
Nobl9 provides extensive capabilities for setting up reports and dashboards to gain data-driven insights into your SLOs. You get out-of-the-box reports on SLO history, error budget status, resource usage, system health, etc., alongside custom reports.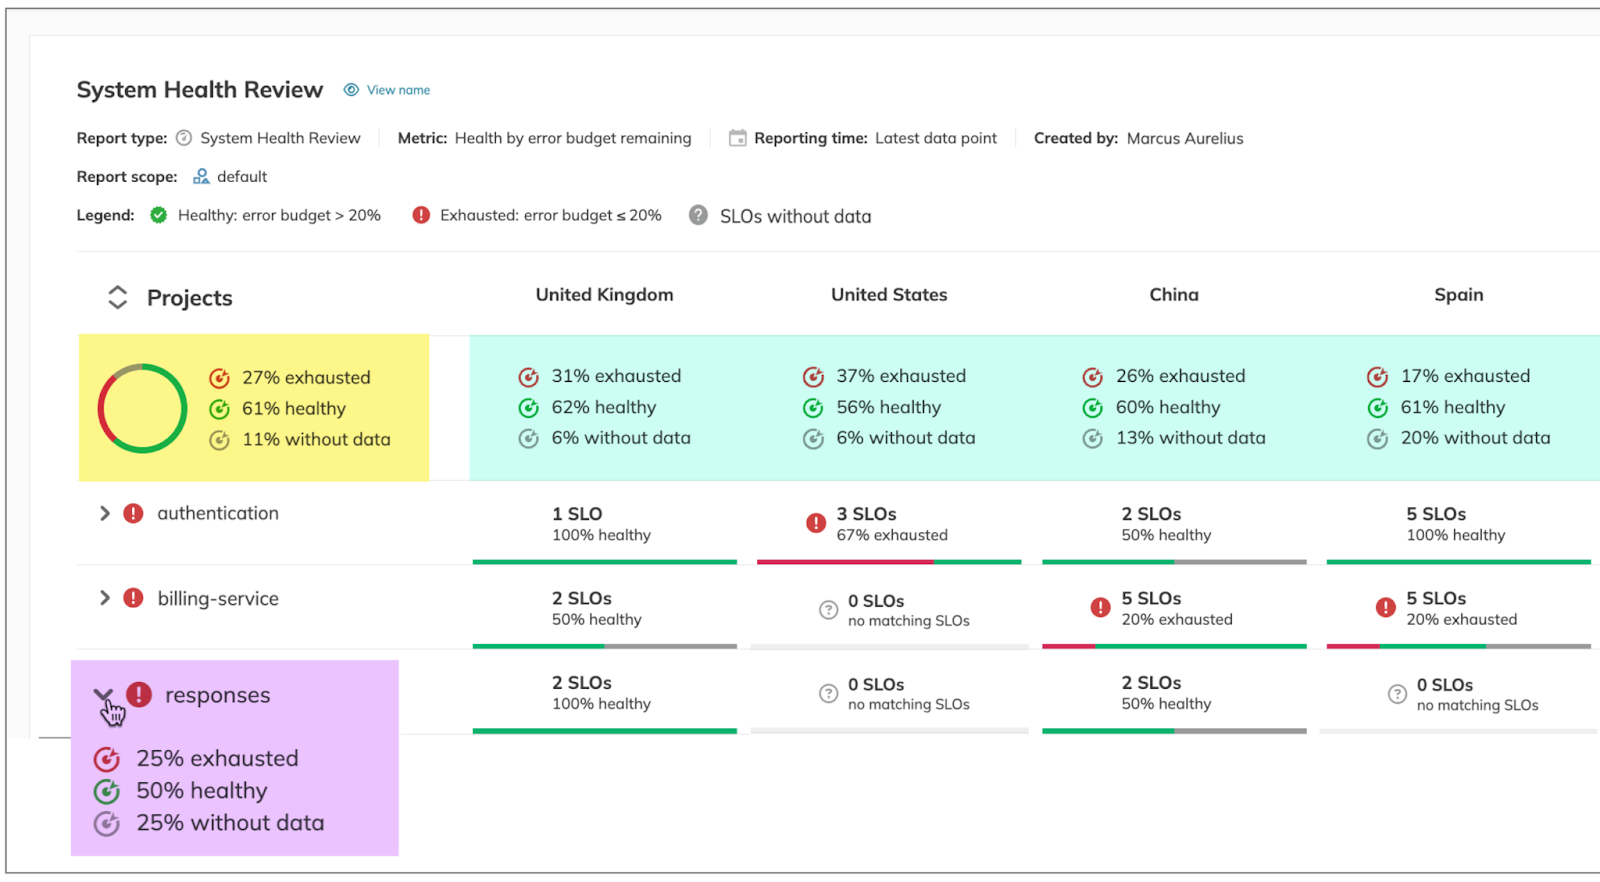
Navigate Chapters: